> ## Documentation Index
> Fetch the complete documentation index at: https://docs.uselotus.io/llms.txt
> Use this file to discover all available pages before exploring further.
# Create Metrics
> Creating billable metrics is the first step in setting up your pricing on Lotus.
Metrics represent everything that you want to track in your software and either bill on, or restrict access to. The metrics you define can later be packaged into plans and used to bill your customers or regulate their access to parts of your product based on their usage.
Lotus supports three types of metrics out of the box:
1. **Counter**
Counter metrics allow you to track specific events or the properties of events, such as the total number of API calls made to a service or the sum of bytes uploaded. The key feature of counter metrics is that they aggregate data, similar to SQL-like aggregations like SUM or COUNT.
2. **Gauge**
Gauge metrics track updates to a specific state, such as the number of active seats or the storage currently in use. The key difference between gauge and counter metrics is that events in gauge metrics simply represent changes to the state, whereas counter metrics aggregate data over events. Some examples of gauge metrics are the number of active seats in a SaaS product or the number of GB used in a storage service.
3. **Rate**
Rate metrics are similar to counter metrics in that they aggregate data over time periods. However, rate metrics have a finer granularity than billing periods, such as the number of database inserts per minute. This allows you to track usage that can be billed based on a time-based rate, such as the number of database inserts per minute.
### Counter Metrics
Defining a counter metric starts with defining the `metric_name`(display name
for your metric) and `event_name`, the name of events that will be used to
calculate the metric. For more details about how to log events and how to pass
in an event name, please refer to the [Logging Events](/metering/logging-events)
section.
Next, define the aggregation type. To pick an aggregation type, think about how
you want to pass in usage information as events into Lotus. Many of the
aggregation types depend on you passing in certain key/value pairs in the
properties.
The allowed aggregation metrics are:
* `COUNT`
* A simple count over the total number of events recorded during the billing
period.
* `UNIQUE` **:property field required**
* Count the distinct number of values that the property had during the billing
period.
* `SUM` **:property field required**
* Sum over a certain property of each event
* `MAX` **:property field required**
* Take the max of a certain property field over all events.
### Gauge Metrics
To define a gauge metric, you'll need to specify the event\_name, metric\_name, and event\_type. Lotus currently supports two event\_types: DELTA and TOTAL. The DELTA event represents a change in the underlying state, such as a change in the number of active seats, and could have values like +1 or -2 to represent a seat(s) being added or removed. The TOTAL event represents the current value of the underlying state, such as the total gigabytes of storage a customer is using.
Gauge metrics can additionally can have an optional `proration` field. The allowed values for `proration` are `second`, `minute`, `hour`, `day`, `month`, `quarter`, and `year`. The proration fieldis a way for you to allow for "fair" pricing.
For example, Notion's pricing states:
If you added members, your account will be charged a prorated amount based on
the percentage of the billing cycle left at the time each member was added. If
you removed members, your account will be credited in the same way.
— [Notion](https://www.notion.so/pricing)
In this case, you would set the `proration` to `day`, and we would automatically
take care of the rest.
### Rate Metrics
Rate metrics are used to track the number of occurrences of a specific event over a smaller period of time than the duration of a subscription.
To define a rate metric, you'll need to specify the `event_name` and `metric_name`. Additionally, you'll need to specify the `granularity` of the metric, which determines the size of the subperiods to track your metric over. The allowed granularities for rate metrics are `minute`, `hour`, `day` and `month`.
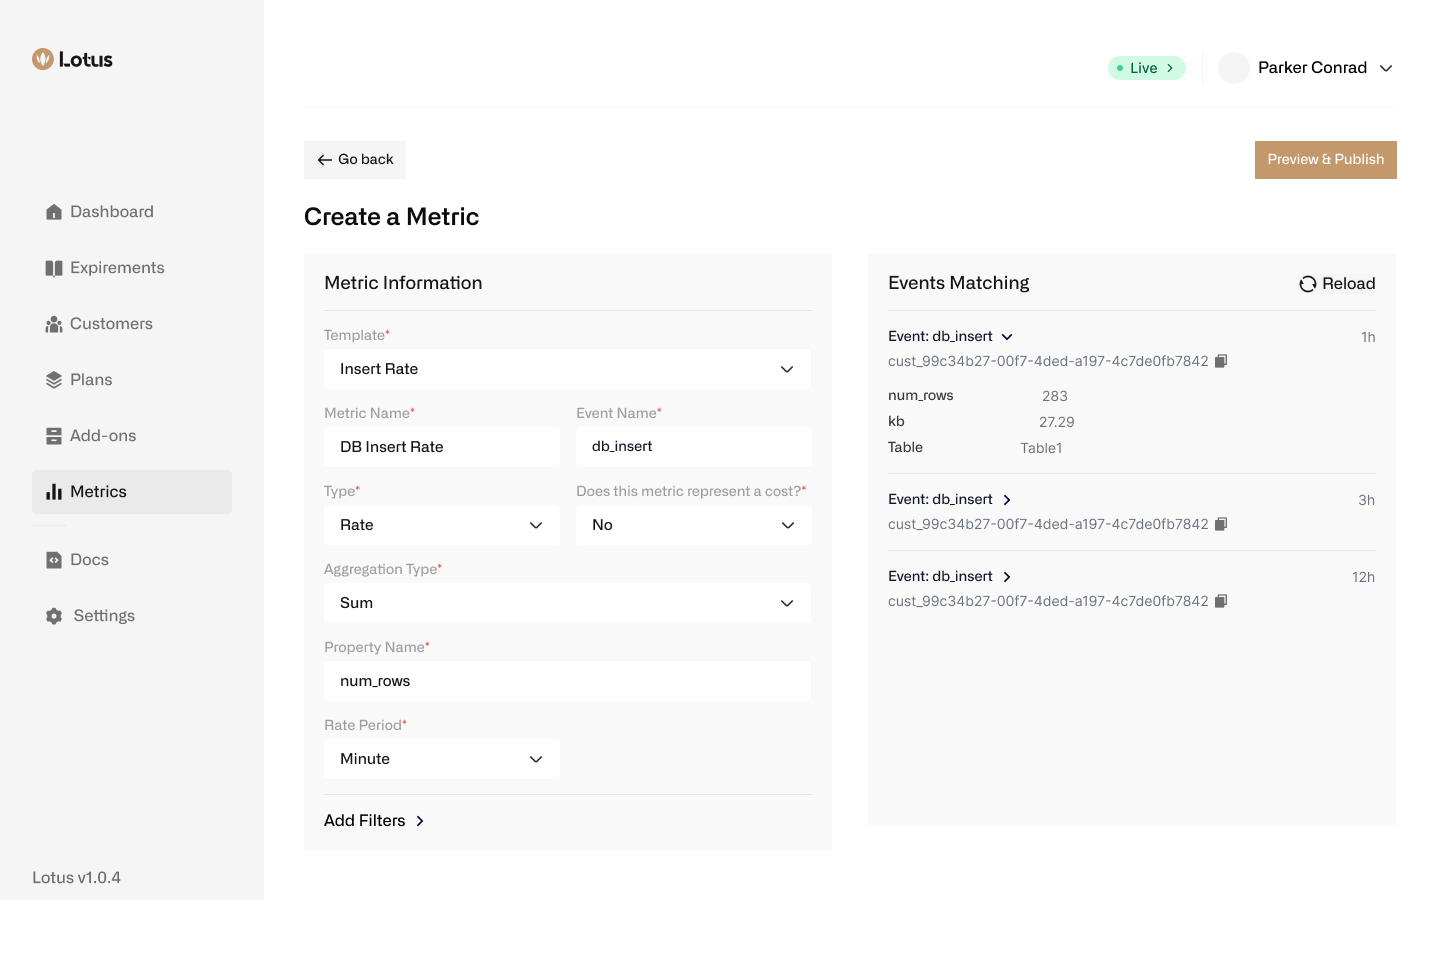
For example, you may have a metric that tracks the number of rows inserted into your database. If you only wanted to allow a certain number of database inserts per hour, you would set the `granularity` to `hour`.
The aggregation within the subperiod works the same way as counter metrics. To calculate whether a customer has exceeded their rate limit, you must specify an `aggregation_type`. The allowed values are `COUNT`, `SUM`, and `MAX` (`UNIQUE` is not supported at this time).
## Examples
#### Counter Metric
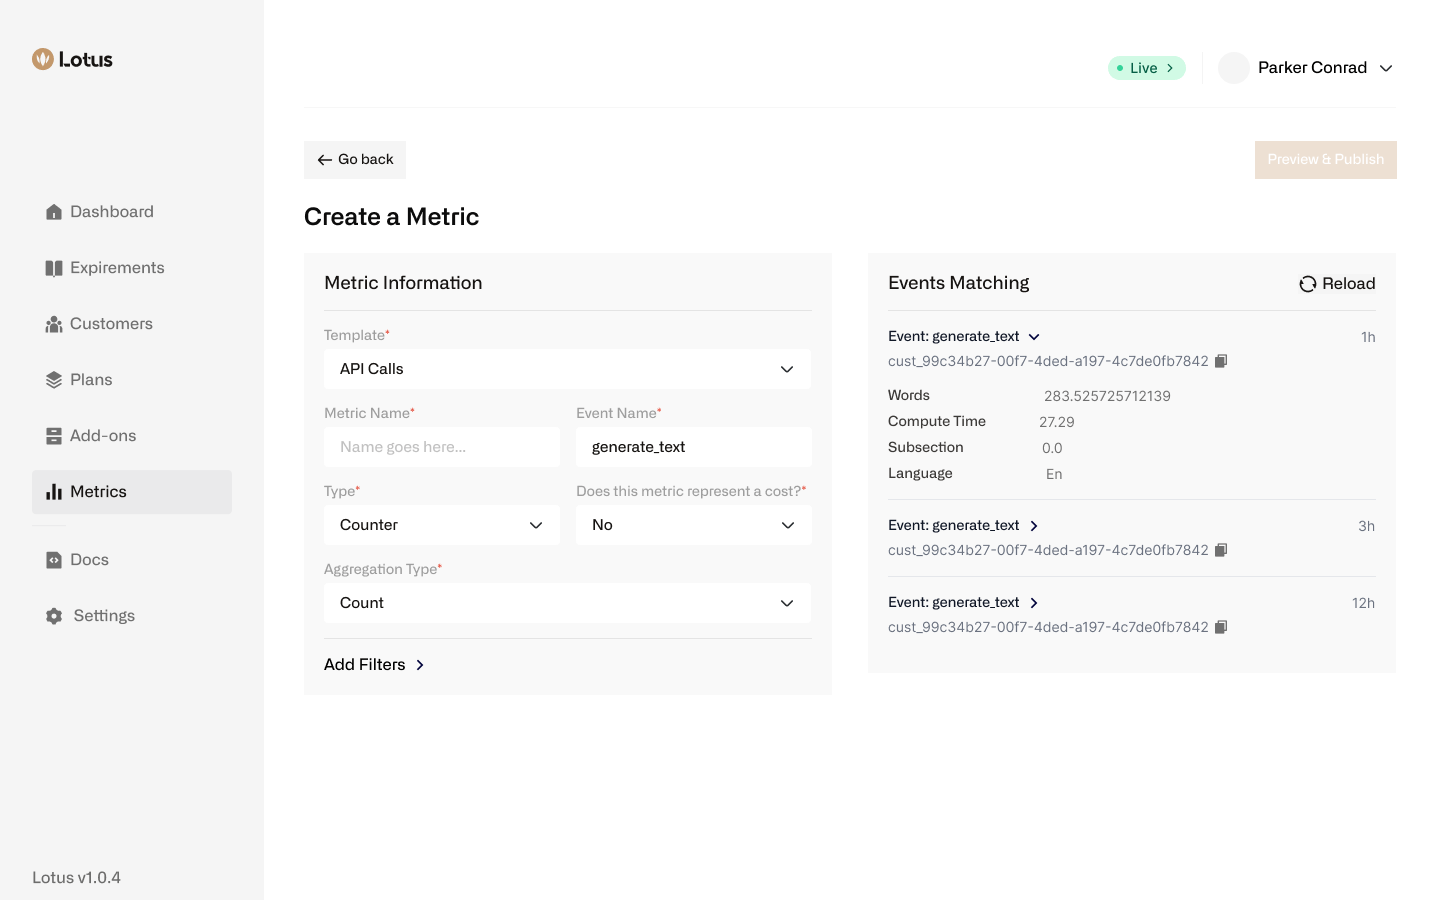
The following example shows a counter metric that takes in events called
`generate_text`. At the end of the billing period, we will take the `COUNT` of events with this name. That will be a customer's usage for the billing period. We will later define how to transform that usage quantity into a price, specifically when creating [plan components](/plan-management/creating-plans).
 #### Gauge Metric
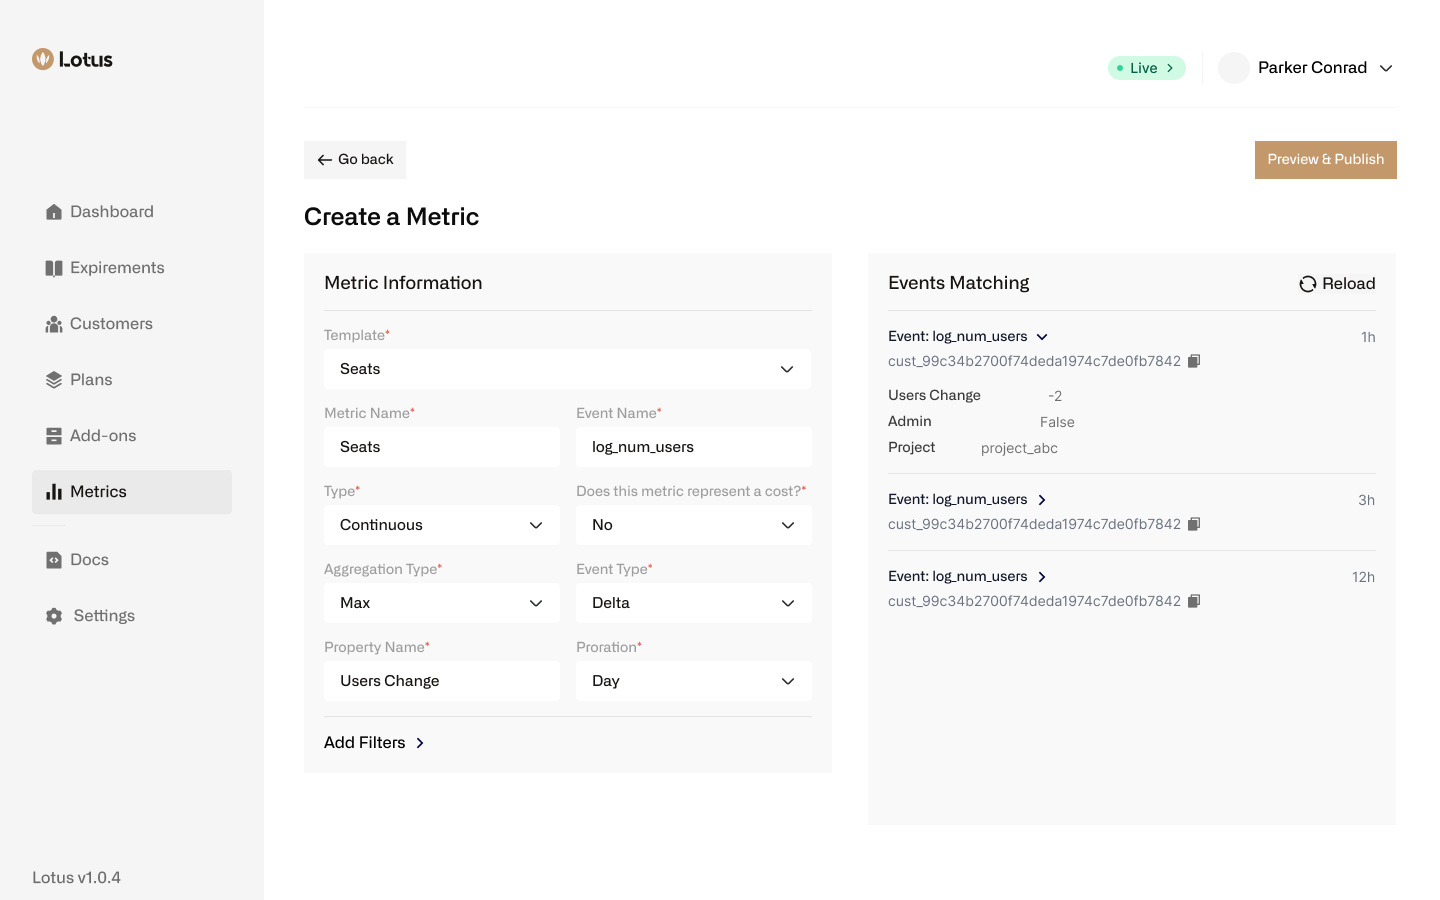
Here is how we woudl define a gauge metric that tracks the number of active seats. We are using `DELTA` events, which means we are tracking the change in the number of active seats. We are also using the `day` proration, which means we will prorate the price based on the number of days of the billing period the seat was active.
#### Gauge Metric
Here is how we woudl define a gauge metric that tracks the number of active seats. We are using `DELTA` events, which means we are tracking the change in the number of active seats. We are also using the `day` proration, which means we will prorate the price based on the number of days of the billing period the seat was active.
 #### Rate metric
This example shows how we might implement a rate metric that tracks the number
of rows inserted into a database.
#### Rate metric
This example shows how we might implement a rate metric that tracks the number
of rows inserted into a database.